If you own or invest in retail property, here is one truth that changes everything: it is not just about the building. It is about the people walking through the door. Retail property foot traffic demographics analysis tells you who those people are, when they show up, and what they want, and that knowledge is worth more than almost anything else in real estate.
What Is Retail Property Foot Traffic Demographics Analysis?
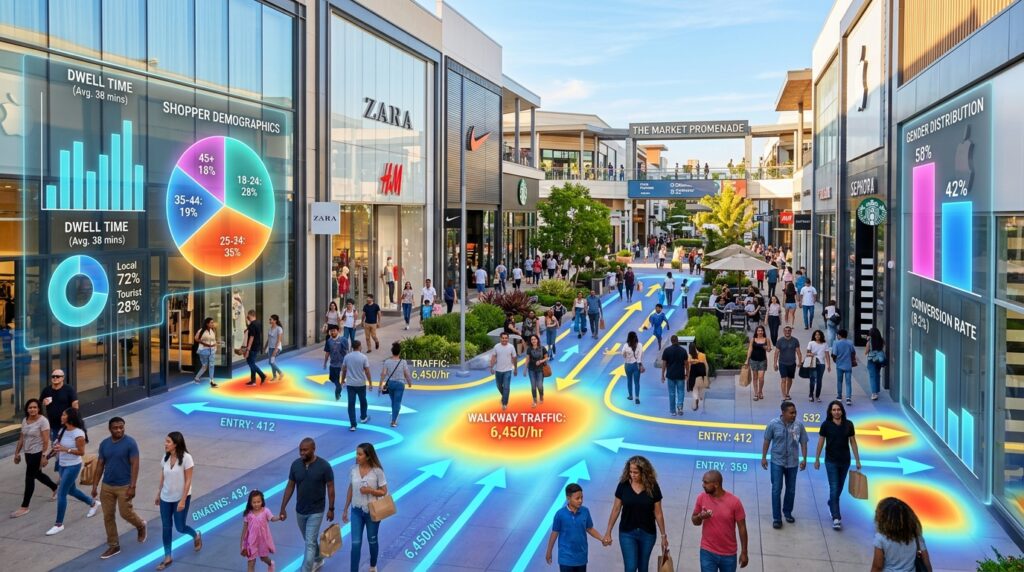
Retail property foot traffic means the number of people who visit a store or commercial space in a set time period. Foot traffic analysis is how you collect that data and make sense of it.
But here is where it gets interesting. When you add demographics to the mix, you stop just counting heads. You start learning things like: Are the visitors young or older? Do they come from nearby neighborhoods or far-away zip codes? Are they high-income shoppers or budget-conscious buyers?
I once spoke with a small strip mall owner who had decent visitor counts but terrible tenant turnover. When he finally ran a proper demographic overlay, he found out most of his visitors were families with young kids, but he had no family-friendly stores. One data check changed his whole leasing strategy.
Foot traffic data combined with visitor demographics gives you a full picture of the real people bringing your retail property to life.
Why Demographics Data Makes Foot Traffic Counts More Powerful
Raw visitor counts tell you how many people came. Demographic data tells you if those people are the right fit for your tenants.
Think of it this way. A strip mall might get 5,000 weekly visits. But if 80% of those visitors are retirees on fixed incomes, a trendy sneaker shop will struggle. Knowing the age range, household income, family size, and shopping habits of your visitors lets you match tenants to the actual audience walking your property.
According to a 2025 study reported by Colliers, grocery stores, sporting goods retailers, and mass merchandise stores were the top performers in foot traffic for two straight years, largely because they matched the shopping needs of the demographics visiting those areas.
This is the power of connecting visit data with visitor income, age, and behavioral patterns.
How to Collect Retail Foot Traffic and Demographic Data
Modern Tools and Technology for Data Collection
Gone are the days of a person with a clicker at the door. Today, mobile GPS tracking, Wi-Fi and Bluetooth sensors, and AI-powered cameras do the heavy lifting.
Here is how it works in simple terms. Most shoppers carry a smartphone. That phone sends out location signals. Companies like Placer.ai and others collect those signals through apps where users agreed to share location data. The data is then cleaned up, grouped, and turned into foot traffic metrics your team can actually use.
These tools create geofences, which are digital borders drawn around a specific property. Every time a phone enters that boundary, it registers as a visit. You can see how long they stayed, how often they came back, and which parts of the property they visited.
For smaller properties on a tight budget, basic infrared counters at entrances are still useful. They do not give you demographics, but they give you a reliable baseline of visitor volume over time.
Traditional vs. Digital Data Sources
Not every property has the budget for full location intelligence platforms right away. Here is a quick breakdown of what each method gives you:
| Method | What You Get | Best For |
| Manual counting | Visit volume only | Small shops, low budget |
| Infrared sensors | Entry/exit counts | Baseline tracking |
| Wi-Fi tracking | Dwell time, repeat visits | Mid-size centers |
| GPS/Mobile data | Full demographic overlay | Investors, large centers |
| AI cameras | Movement flow, group size | High-end analysis |
Honestly, most serious retail property owners today use a mix. Start with sensors for volume, then layer in mobile data for the demographic picture.
Key Foot Traffic Metrics That Reveal Demographic Patterns
Visitor Volume, Dwell Time, and Repeat Visit Rate
Three numbers every property owner should know by heart: visitor count, dwell time, and return visit frequency.
Visitor count is the total number of people who came. Dwell time is how long they stayed. A longer dwell time usually signals higher engagement and, often, higher spend. According to 2024 data, Costco shoppers spent an average of 37.3 minutes in-store, well above Walmart at 31.8 minutes, and that longer stay time tracks directly with their strong sales performance.
Return visit frequency tells you about loyalty. If people keep coming back, it means the property is meeting their needs. If visits are one-and-done, something is off.
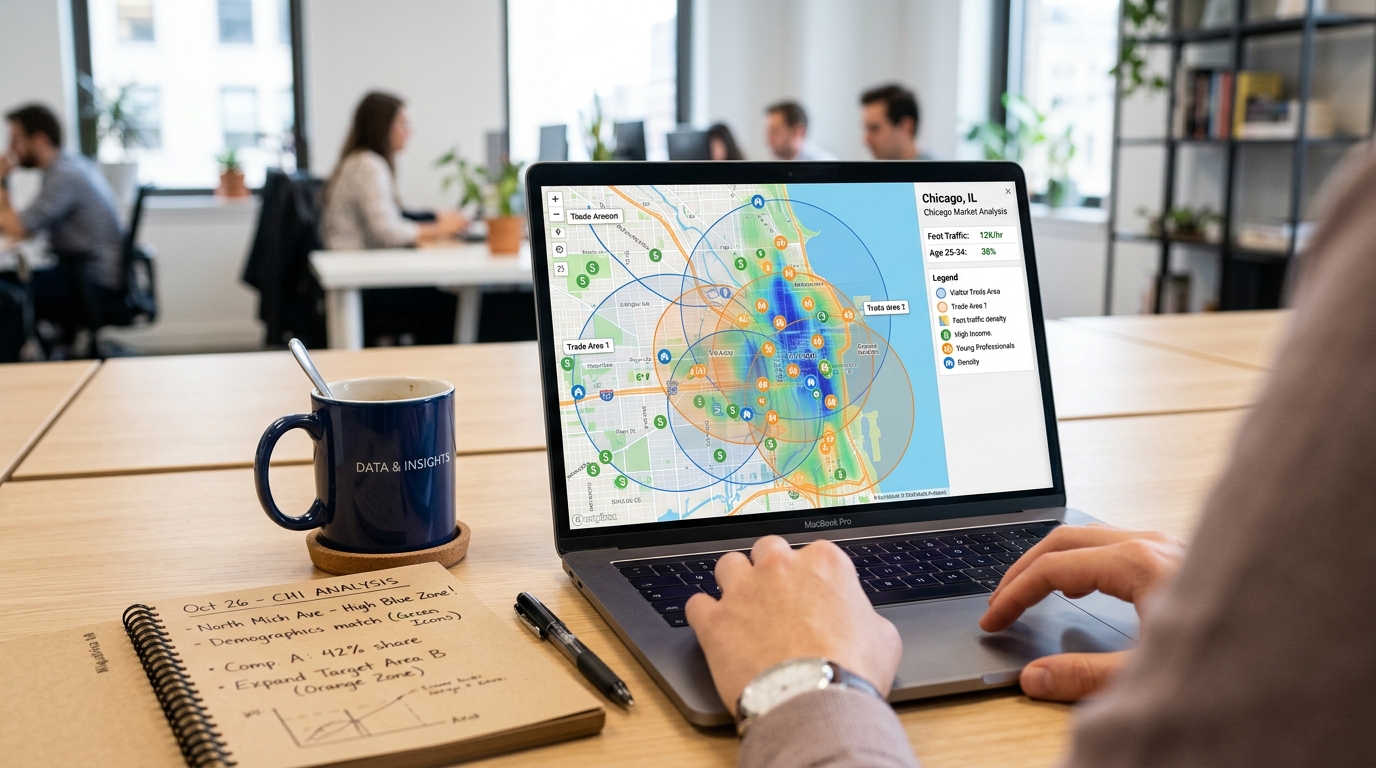
Trade Area Mapping and Customer Origin Data
Trade area analysis shows you where your visitors are coming from. It draws a geographic picture of the neighborhoods sending people to your property.
This matters a lot for demographics. If most of your visitors come from a high-income zip code nearby, you know what kinds of tenants will perform well. If they are coming from lower-income areas, budget-focused retailers and essential services will be a better fit.
Cross-visitation patterns also matter. If visitors frequently go from your property to a competitor next door, that tells you something about unmet needs. That is a gap you can fill with better tenant selection.
Using Demographics Analysis to Improve Property Performance
Tenant Selection and Lease Negotiation
Here is where retail property foot traffic demographics analysis becomes a real money-maker. When you know who is walking your property, you can go after tenants who match that audience perfectly.
A property owner with strong data on their visitor demographics can walk into a lease negotiation with confidence. High foot traffic from a desirable demographic is a real bargaining chip. I have seen landlords use this data to justify premium rents because the numbers proved the tenant would get the right customers.
On the flip side, if your data shows declining visits from a key demographic group, you can catch that early and act before it hurts your NOI (Net Operating Income). According to reporting from ADVAN Research, a grocery anchor showing an 8% visit decline while comparable stores stay flat is an early warning sign that should trigger action before it hits the bottom line.
Marketing, Events, and Space Planning
Once you understand your visitor demographics, you can plan events and promotions that actually connect with your audience. If your data shows families with kids visit most on weekends, family-friendly weekend events make perfect sense.
Space planning also improves dramatically. High-traffic zones within the property are better suited for anchor tenants and experiential retail. Low-traffic zones might need better signage or a layout change to pull shoppers in deeper.
According to a 2025 report from MRI Software, property managers who use footfall data to plan events and adjust space layouts see better tenant retention and stronger overall property performance.
Real Investment Decisions Powered by Foot Traffic Demographics
Site Selection for New Retail Locations
For investors evaluating new properties, retail foot traffic data is the single most powerful input in the site selection process. It reflects what people actually do, not what surveys say they might do.
The strongest site selection process layers together: visit counts, trade area mapping, dwell time benchmarks, cross-shopping patterns, and demographic overlays. Companies like TNT Fireworks used this kind of data to review ten times more sites per committee meeting and open 150+ locations in under six months, as reported by GrowthFactor in 2025.
The key move is what analysts call “analog store matching.” You find your best-performing existing locations, study their visitor demographics, and then search for new sites where the demographics look similar. It takes the guesswork out of expansion.
Hold, Sell, or Reposition Decisions
Foot traffic trends also guide long-term investment decisions. If visits are growing steadily from a desirable demographic group, that signals long-term value worth holding onto.
If visits are trending down and nearby competitors are pulling share, that might signal it is time to reposition the property or sell. These are not easy calls, but they are much easier when real behavioral data backs them up instead of gut feeling alone.
According to data tracked by Placer.ai and reported in their 2024 recap, overall retail visits grew 0.4% year-over-year in 2024. That is a small number, but it proves in-person shopping is still resilient. Discount and dollar store categories led growth at 2.8% YoY, while discretionary categories like furniture struggled early in the year before recovering in Q4.
Conclusion
Retail property foot traffic demographics analysis is not a luxury tool for big investors. It is a practical, powerful way for anyone who owns or manages retail property to make smarter decisions every day. Whether you are picking a new location, choosing tenants, planning an event, or deciding whether to hold or sell, the answer almost always lives in the data about who is walking through your doors.
The good news? The tools are more accessible than ever. Start with what you can afford. Layer in more data as your portfolio grows. And always ask the question that changes everything: who is actually coming, and what do they need?
I would love to hear your experience with this. Have you used foot traffic data to make a real estate decision? Drop your thoughts below.
Frequently Asked Questions
What is retail property foot traffic demographics analysis?
It is the process of collecting data on how many people visit a retail property and combining that with information about who those visitors are. This includes their age, income, where they come from, and how often they return. The goal is to turn raw visit counts into useful knowledge about your actual audience so you can make better decisions about tenants, marketing, and investments.
What tools are used to measure retail foot traffic demographics?
Common tools include mobile GPS tracking, Wi-Fi and Bluetooth sensors, infrared entry counters, and AI-powered cameras. Companies like Placer.ai use anonymous mobile data to build detailed reports on visitor volume, dwell time, return frequency, and demographic profiles. Smaller properties often start with basic infrared counters and upgrade to mobile data platforms as their needs grow.
How does demographic analysis help with tenant selection?
When you know the age, income level, and shopping habits of your regular visitors, you can choose tenants whose products and services match that audience. A property visited mostly by young families will perform better with family-focused retailers than with luxury boutiques. Good demographic data takes the guesswork out of leasing decisions and helps both landlords and tenants succeed.
How is foot traffic data used in retail site selection?
Investors and retailers use foot traffic data to evaluate whether a new location will perform well before signing a lease. They study visit counts, trade area maps, cross-shopping patterns, and demographic overlays. A popular method called “analog store matching” compares the demographics of a new candidate site to those of existing top-performing locations. This helps predict success before any money is committed.
What foot traffic metrics should a retail property owner track?
The most important metrics are visitor count (total people entering), dwell time (how long they stay), repeat visit rate (how often the same people return), trade area size (where visitors come from), and demographic breakdown (age, income, household type). Together, these metrics give a complete picture of property health and help identify problems early before they affect revenue or tenant satisfaction.
